Warp Pipe performance analysis
To verify performance and identify bottlenecks of Warp Pipe implementation we have created a Zephyr-based sample based on the native_sim target.
The sample creates 506 threads (as proved to perform stable on a regular PC) and issues 100 transactions per thread.
Each iteration reads 2048 bytes of data, writes it back and then reads it again.
The whole process takes 21 seconds of native_sim time (49s of real time).
Testing plan
Performance analysis should take several points into account:
verification of the impact of a number of threads,
verification of the flow of multiple single-threaded Zephyr instances,
verification of various payload sizes,
verification of various number of iterations per thread.
Currently the testing flow allows to verify different values for scenarios 1, 3 and 4.
Bottleneck analysis
Analysis of potential bottlenecks has to take into account the results of performance analysis, so that the focus is not misplaced on scenarios that are not in need for improvement.
To gather information about most time-consuming issues, we can use the perf tool.
First, compile memory-mock and start it as a background process.
The PID of the process will be used to start up perf.
Before running the process, ensure your system will allow you to gather trace data, by running as root:
echo -1 >! /proc/sys/kernel/perf_event_paranoid
After that you can start memory-mock:
./build_memory_mock/memory_mock &
Next, connect perf to the running process:
perf record -a -F 999 -g -p $!
With the memory-mock set up, you can spawn the Zephyr application:
./build.pcie_native_thread/zephyr/zephyr.exe
The application will print the following output:
*** Booting Zephyr OS build f89c5ddd1aaf ***
[00:00:00.000,000] <inf> pcie_native: Started app
[00:00:00.000,000] <inf> pcie_native: Started client
[00:00:00.000,000] <inf> pcie_native: Registering bar 0 at 0x100000 (size: 128)
[00:00:00.000,000] <inf> pcie_native: Registering bar 1 at 0x140000 (size: 2048)
[00:00:21.000,000] <inf> pcie_native: Done!
When the Done message is printed out, stop the perf process with Ctrl+C.
The last step is to convert perf results to a readable format:
perf script -i perf.data > perf.script
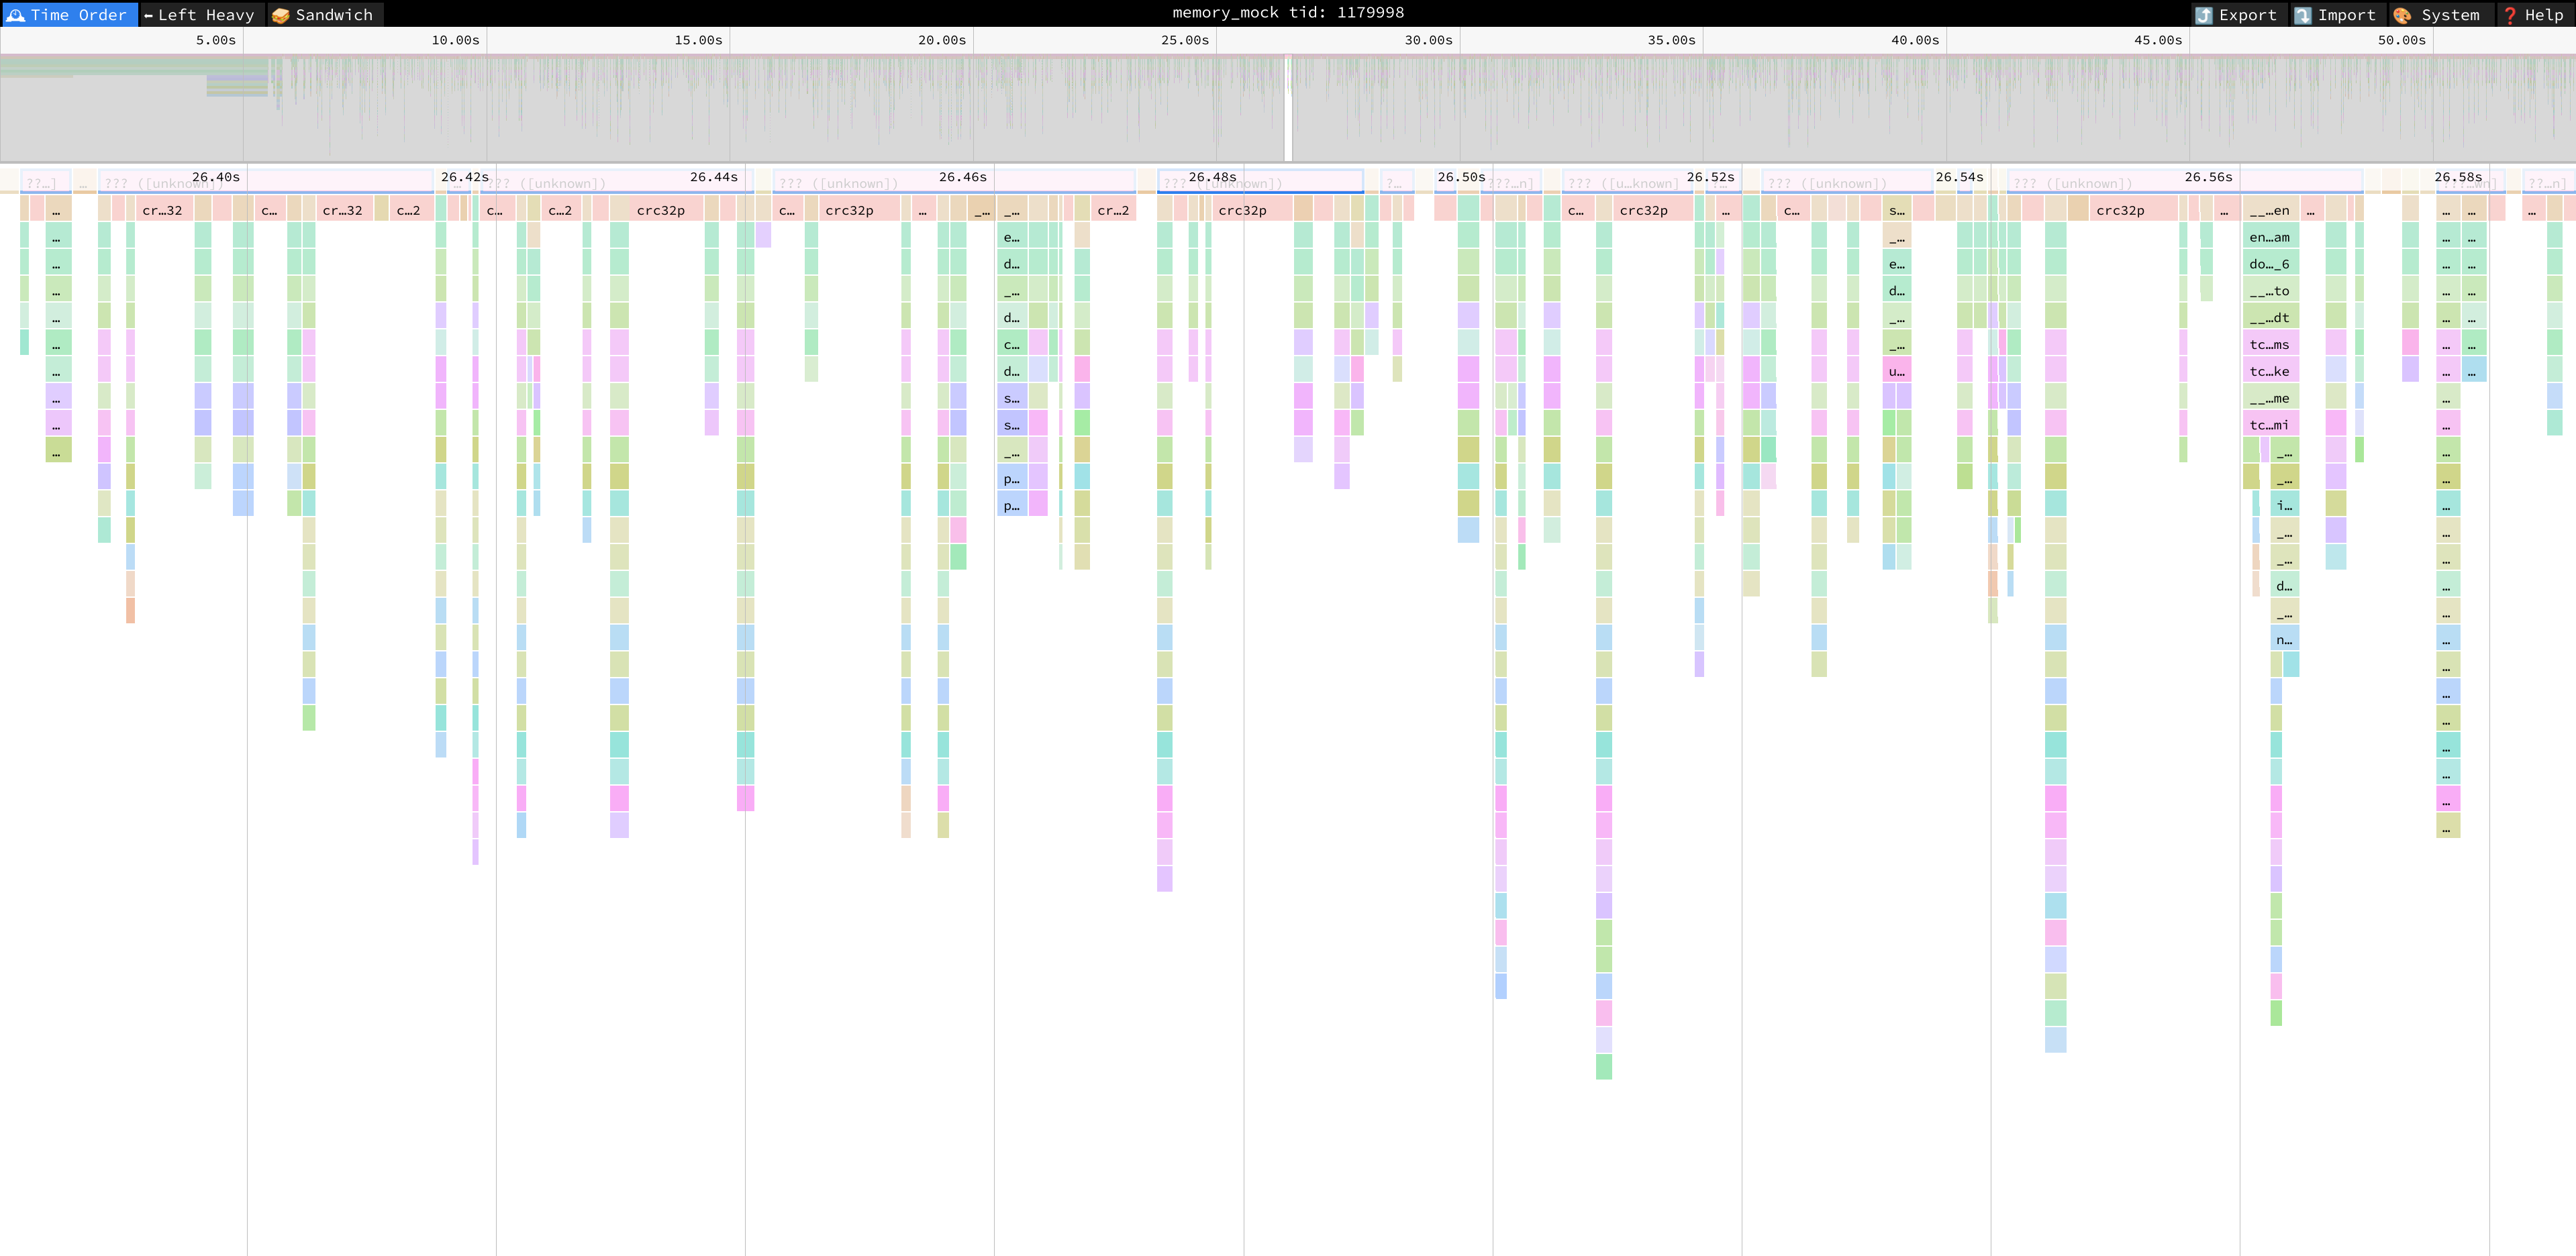
The results, while easily readable, are better presented in a form of flame graph, e.g. with the Speedscope tool:
speedscope perf.script
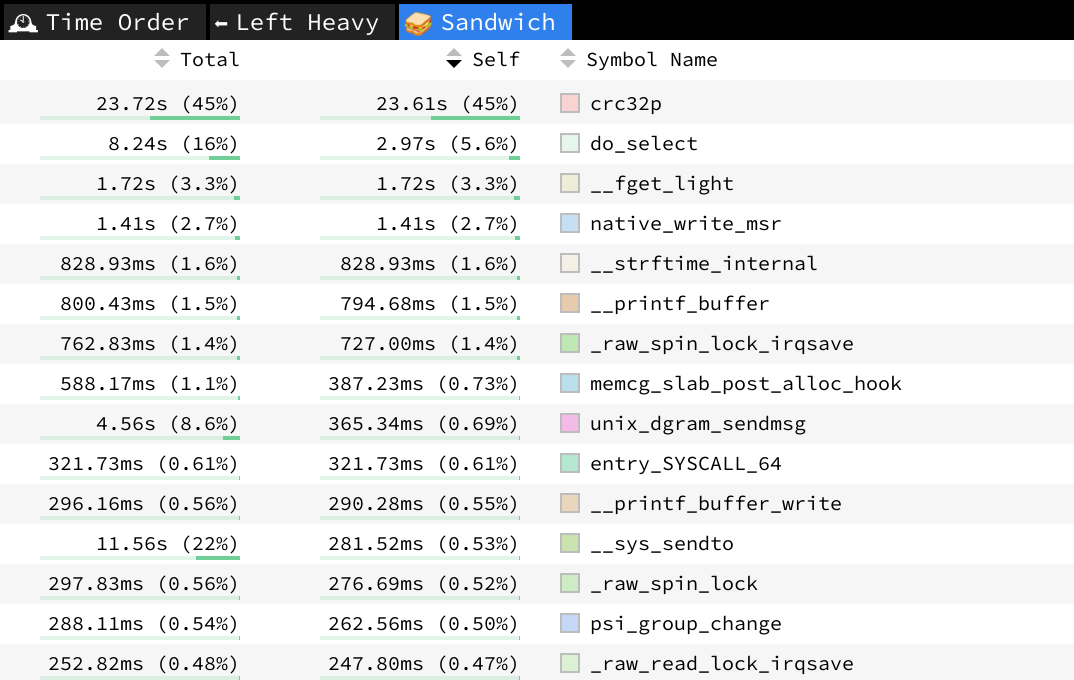
Initial analysis, through the so-called “Sandwich” view, points to the implementation of CRC32 as a potential target of optimization process.

