Quick start
Busperf requires 2 things to analyze performance of the bus:
Bus description: a YAML file which describes the bus(es) we want to analyze
Simulation trace: FST/VCD trace of the simulation
Prepare bus description
Most important part of the bus description is the interfaces block.
Here we define what are the buses that should be analyzed.
interfaces:
  "a_":
    scope: [$rootio, some_module, a]
    clock: "clk_i"
    reset: "rst_ni"
    reset_type: "low"

    handshake: "ReadyValid"
    ready: "a_ready"
    valid: "a_valid"

  "b_":
    scope: [$rootio, b]
    clock: "clk_i"
    reset: "rst"
    reset_type: "high"

    handshake: "APB"
    psel: "b_psel"
    penable: "b_penable"
    pready: "b_pready"
In this example we define 2 buses to be analyzed a_ and b_.
For each bus those 4 elements are always required:
scope- scope path to the signalsclock- name of the clock signalreset- name of the reset signalreset_type- reset active polarity “high” or “low”
Later, we define the bus handshake and names of its signals. List of signals required by each supported handshake can be viewed in Analyzers chapter.
For full overview of the syntax see YAML bus description chapter.
Run busperf
Busperf can be run with:
$ busperf analyze --gui TRACE BUS
Replace TRACE with a path to the simulation trace and BUS to bus description.
View the statistics
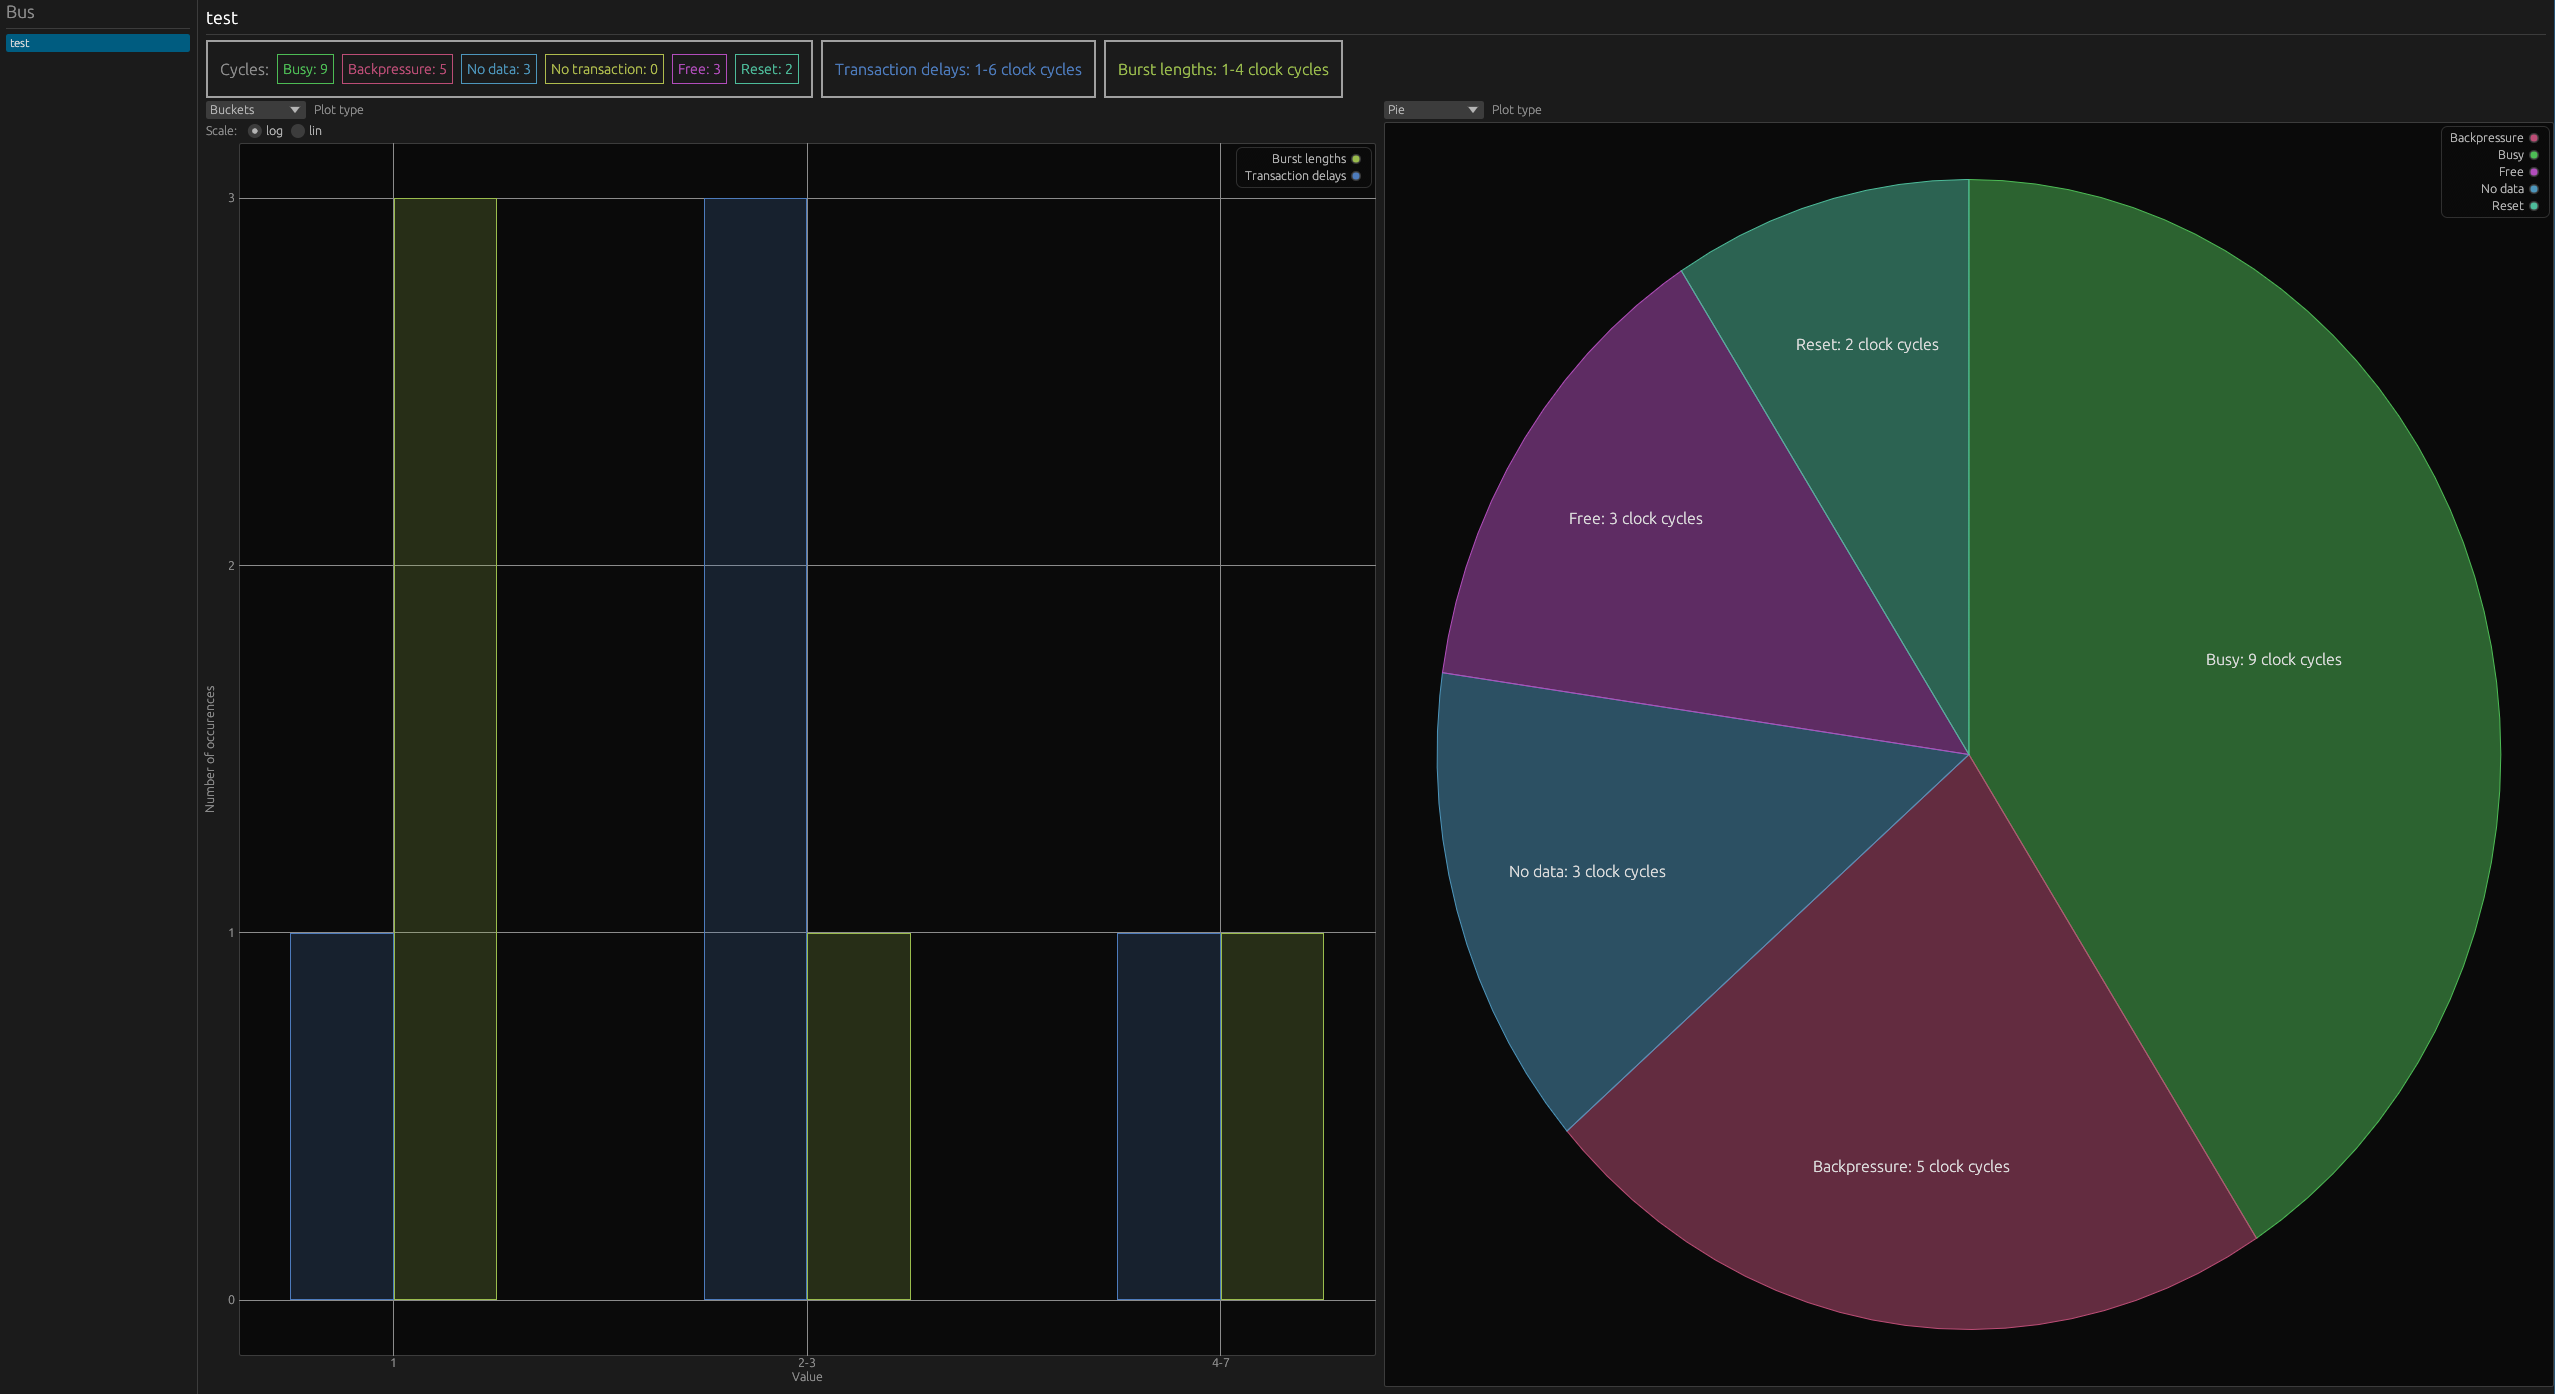
The --gui option, which we provided in the last step, presents the statistics in a graphical window.
To use formats --csv, --md, --text or --save can be passed instead.
You can read a detailed description of statistics in Output chapter.