Zeppelin Trace Viewer
Zeppelin Trace Viewer is a visual interface for traces in Trace Event Format (TEF). To fully utilize the features of the viewer, we suggest processing traces with the CTF converter.
Go to the GitHub-hosted Zeppelin Trace Viewer to begin analyzing traces.
Requirements
The viewer leverages workspaces to manage third-party dependencies like Speedscope. This requires yarn in version 1.x or newer, provided by corepack (usually installed together with Node.js):
# Allows to use package managers without having to install them
corepack enable
# Downloads specified version of yarn and all dependencies
yarn
Building
There are several predefined commands with basic utilities:
yarn build- Builds for production, emitting todist/yarn preview- Starts a server athttp://localhost:4173/to test production build locallyyarn dev- Starts a dev server athttp://localhost:5173/yarn lint- Lints a code and applies all applicable fixes
Usage
The viewer is built around Speedscope - an interactive flamegraph viewer with support for many trace/profiling formats.
To display a trace, simply import a TEF file using the File/Import trace (or Browse) button (Fig. 1).
This action will change the internal state of Speedscope, which triggers the reaction of Additional info section.
It gathers metadata and initializes custom panels based on available data.
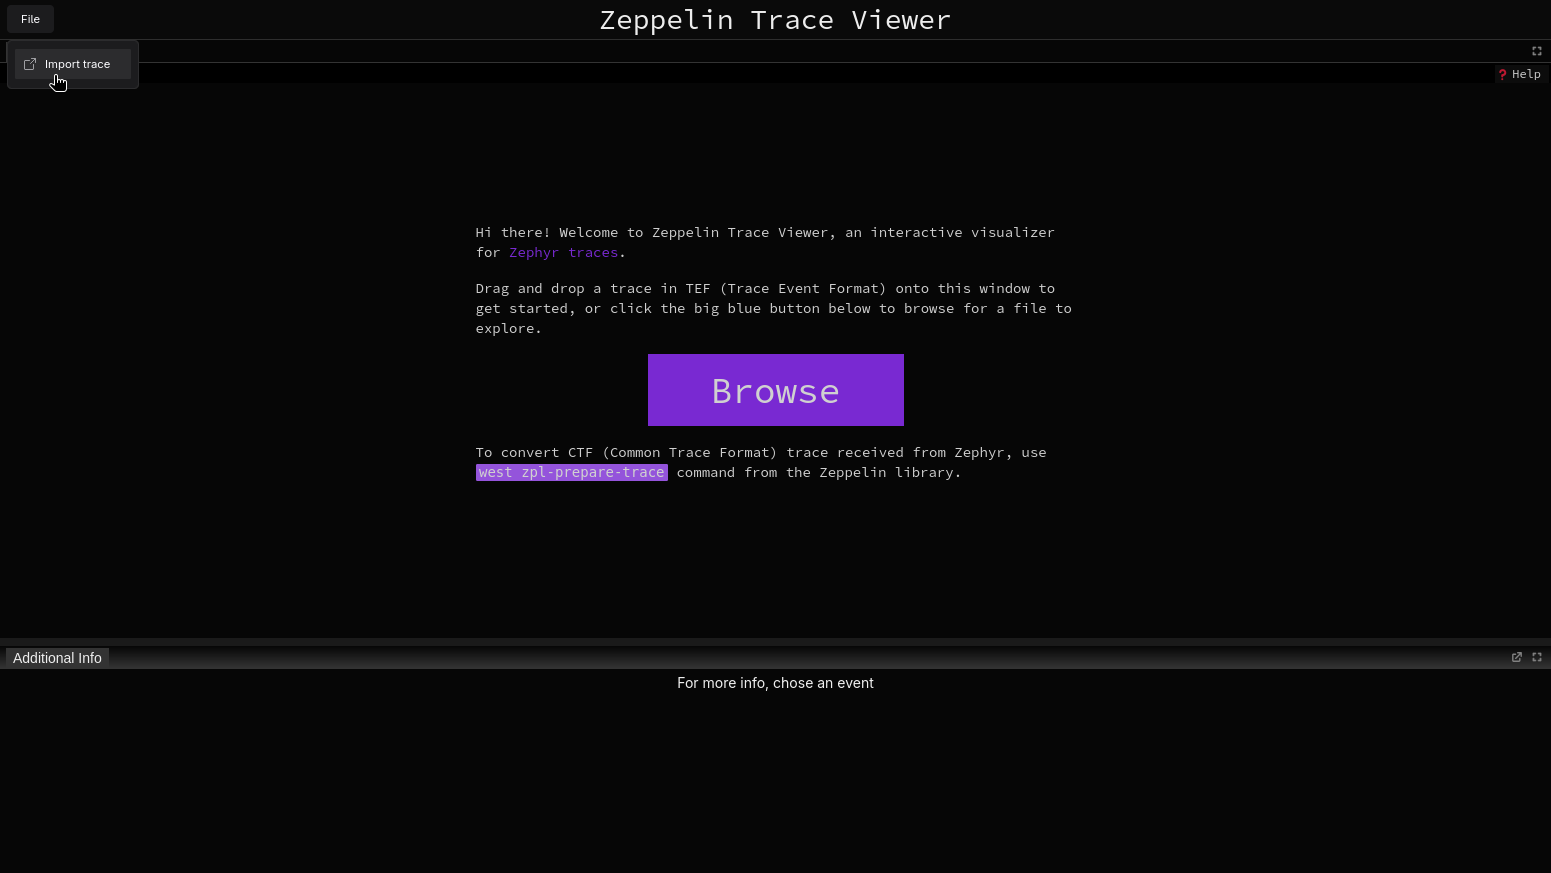
Fig. 1 The main page of Trace viewer
To checked out an iterative version of the Zeppelin Trace Viewer select one of the examples below:
Model info panel
The model info panel displays details about the selected event and the corresponding layer.
Currently, it supports TFLite Micro (Fig. 2)
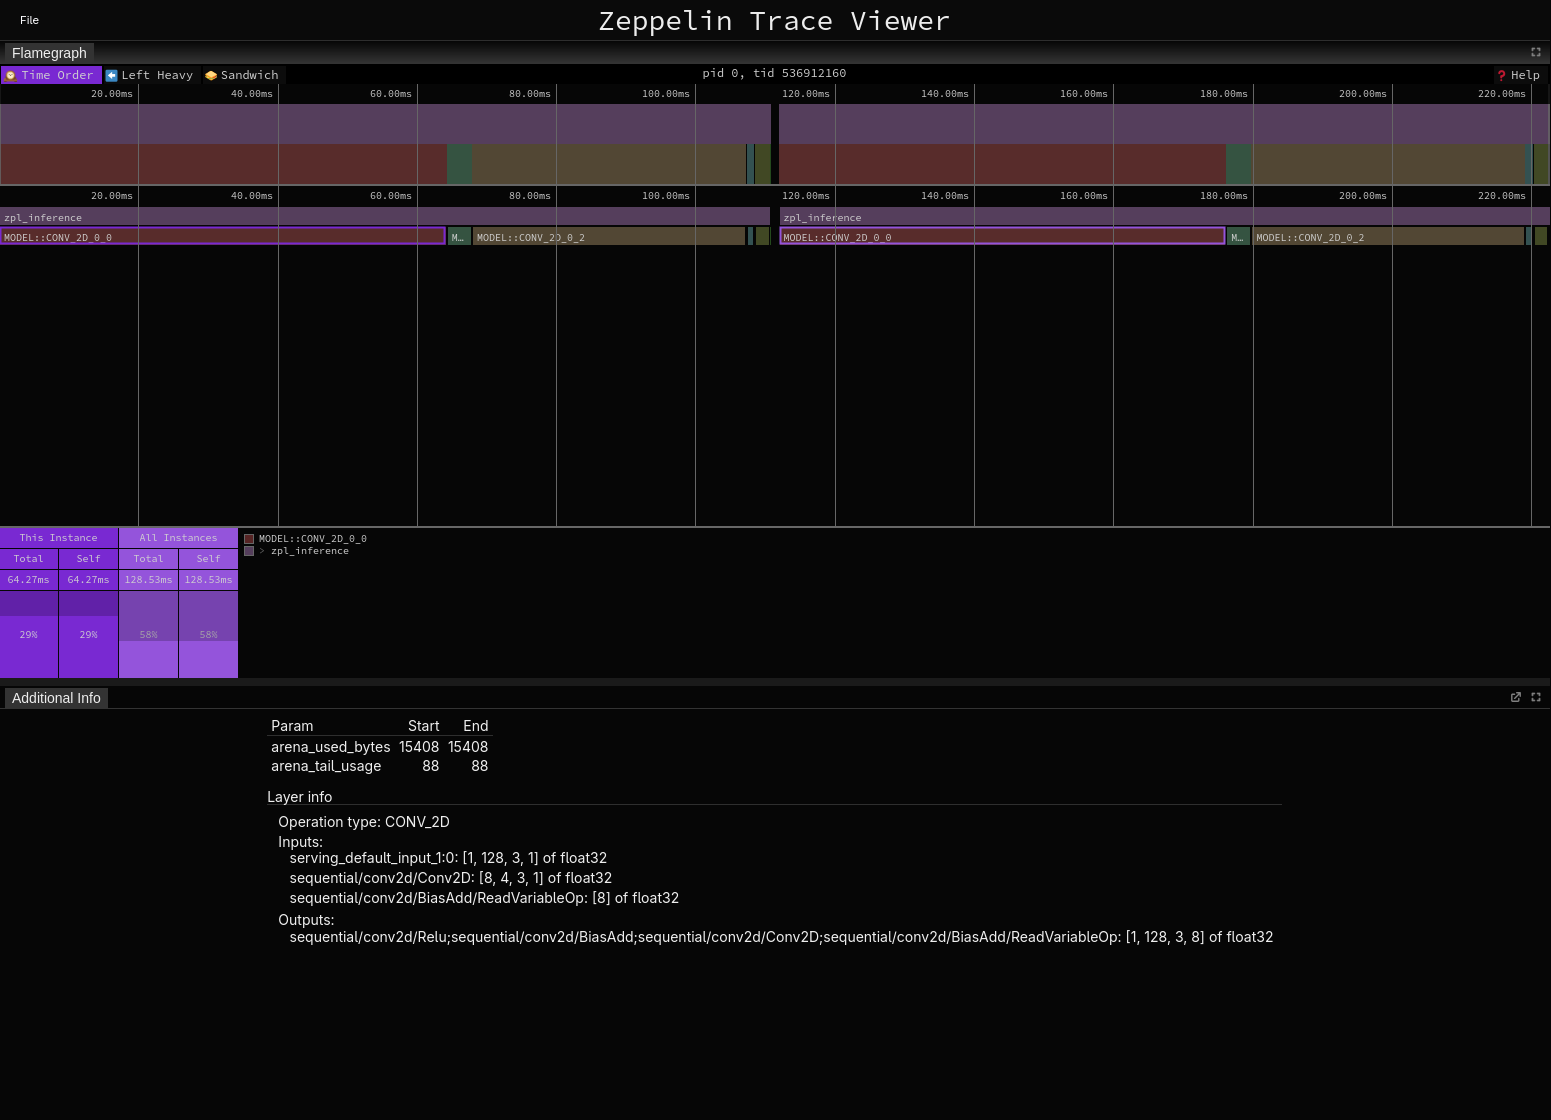
Fig. 2 The TFLite micro model information example
and microTVM runtime (Fig. 3).
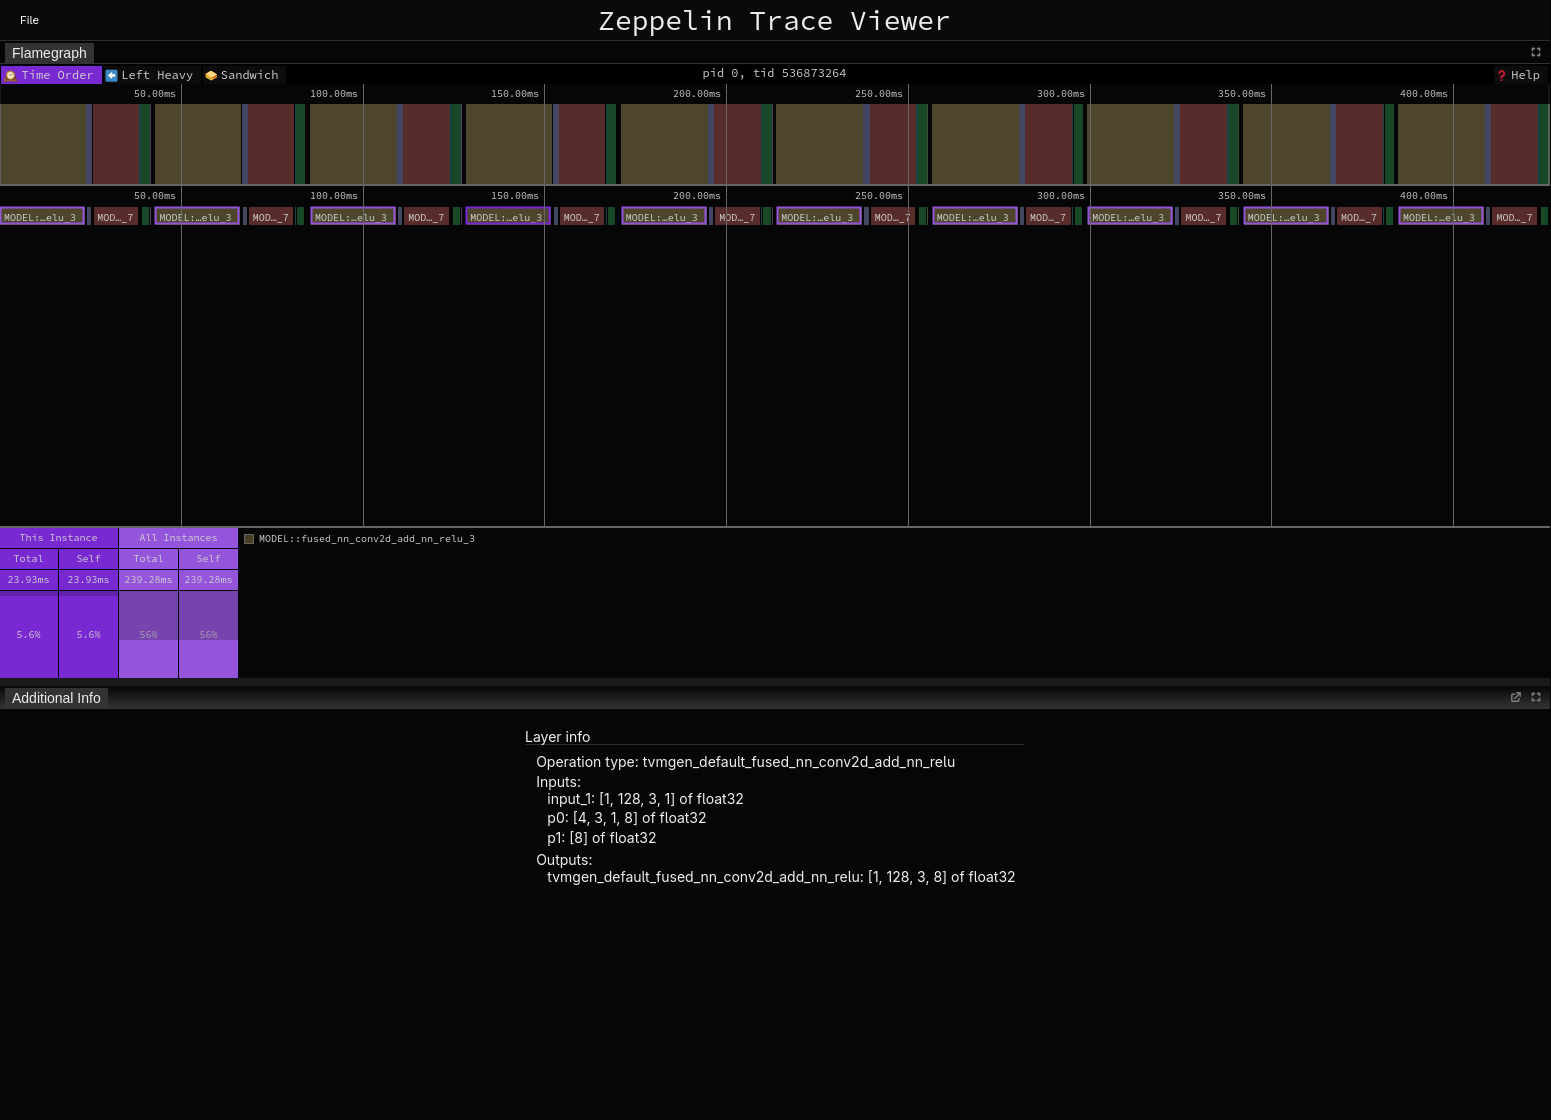
Fig. 3 The microTVM model information example
Plot panels
The trace viewer can also visualize resource usage (like memory or CPU load) or data from sensors (such as DIE temperature) using plots (Fig. 4).
Panels with these plots are automatically created whenever a trace with necessary data is loaded:
MEMORY events for memory plots,
CPU_LOAD events for CPU load plot,
DIE_TEMP events for DIE temperature plot.
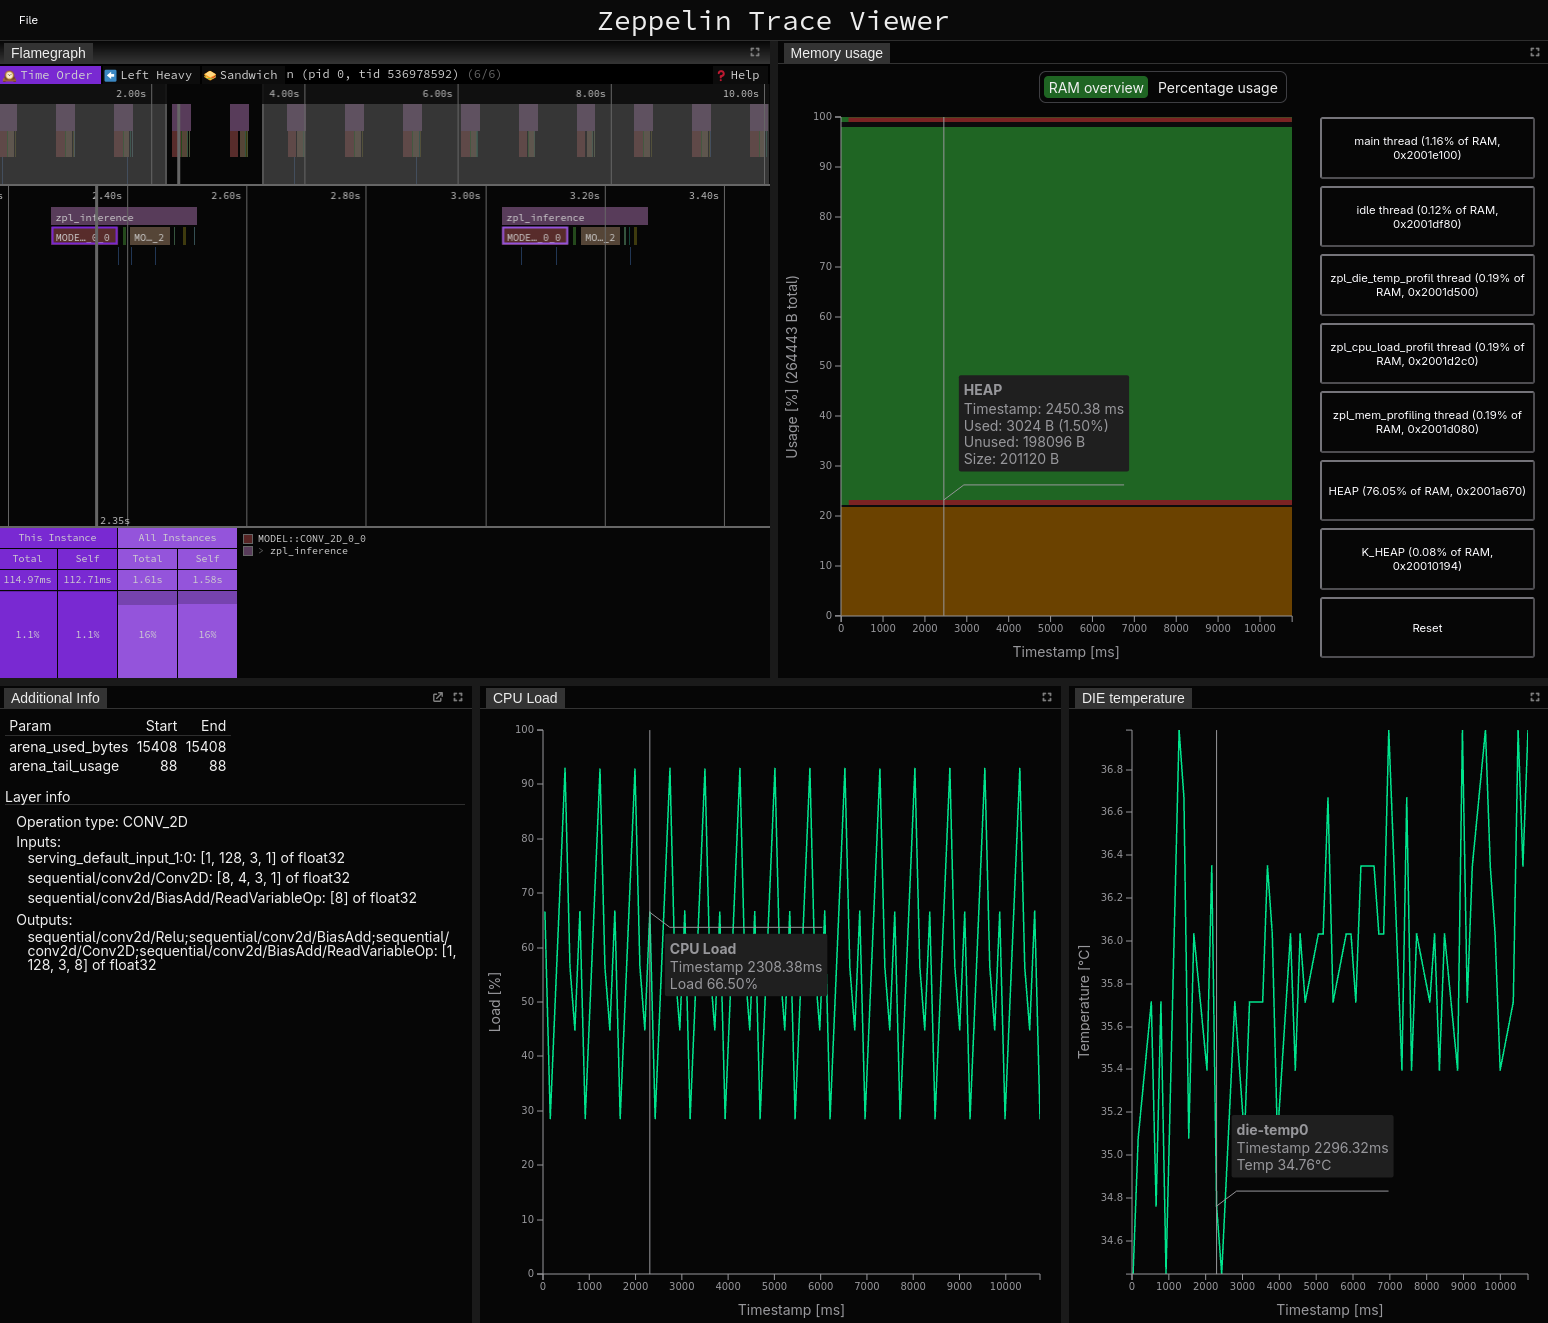
Fig. 4 The memory usage example