Sample AutoML report
This section contains a sample AutoML report generated during CI.
The CI is set up as follows:
Environment: Github Actions
Task: Anomaly Detection
AutoML framework: Auto-PyTorch
Compiler framework:
TFLite,Platform: MAX32690 Evaluation Kit
AutoML statistics
Optimized metric: f1
The number of generated models: 55
The number of trained and evaluated models: 43
The number of successful training processes: 52
The number of models that caused a crash: 0
The number of models that failed due to the timeout: 0
The number of models that failed due to the too large size: 3
The number of models that failed due to incompatibility: 0
Training overview
Figure 12 Loss value during AutoML training process
Figure 13 Comparison of loss value across models
Summary of generated models
Figure 14 Metrics of models trained by AutoML flow
Model ID |
Number of layers |
Optimized model size [KB] |
Total parameters |
Trainable parameters |
|---|---|---|---|---|
3 |
7 |
15.5546875 |
2815 |
2814 |
4 |
10 |
49.73046875 |
11623 |
11622 |
5 |
17 |
33.08203125 |
7498 |
7497 |
6 |
21 |
33.4921875 |
7613 |
7612 |
7 |
27 |
61.02734375 |
14094 |
14093 |
8 |
14 |
50.16015625 |
11841 |
11840 |
9 |
21 |
35.60546875 |
7834 |
7833 |
10 |
17 |
37.4296875 |
8732 |
8731 |
11 |
23 |
54.3359375 |
11691 |
11690 |
12 |
21 |
30.37890625 |
7656 |
7655 |
13 |
17 |
33.13671875 |
7799 |
7798 |
14 |
12 |
37.5625 |
8227 |
8226 |
15 |
10 |
42.421875 |
10264 |
10263 |
16 |
13 |
45.5546875 |
10455 |
10454 |
17 |
8 |
19.8671875 |
4364 |
4363 |
18 |
27 |
47.5078125 |
10720 |
10719 |
19 |
10 |
46.0703125 |
11170 |
11169 |
20 |
11 |
32.00390625 |
6570 |
6569 |
21 |
13 |
32.59375 |
7850 |
7849 |
22 |
10 |
34.84375 |
7914 |
7913 |
23 |
14 |
46.69921875 |
10981 |
10980 |
24 |
23 |
47.4765625 |
11121 |
11120 |
25 |
11 |
36.171875 |
8584 |
8583 |
26 |
15 |
21.55078125 |
4368 |
4367 |
27 |
11 |
24.56640625 |
4681 |
4680 |
28 |
19 |
46.17578125 |
10569 |
10568 |
29 |
11 |
34.19140625 |
7146 |
7145 |
30 |
11 |
38.6640625 |
8295 |
8294 |
31 |
9 |
35.125 |
8078 |
8077 |
32 |
13 |
42.62890625 |
10440 |
10439 |
33 |
13 |
18.5390625 |
4599 |
4598 |
34 |
21 |
52.78125 |
12469 |
12468 |
35 |
10 |
38.8203125 |
9133 |
9132 |
36 |
11 |
51.62109375 |
11832 |
11831 |
37 |
23 |
34.12890625 |
7143 |
7142 |
38 |
15 |
24.7421875 |
5204 |
5203 |
39 |
25 |
45.21875 |
9813 |
9812 |
40 |
12 |
45.75390625 |
9549 |
9548 |
41 |
19 |
24.55078125 |
5610 |
5609 |
42 |
19 |
23.66796875 |
5519 |
5518 |
43 |
11 |
38.98046875 |
8819 |
8818 |
44 |
12 |
24.74609375 |
4710 |
4709 |
45 |
19 |
40.88671875 |
9374 |
9373 |
46 |
15 |
38.5703125 |
9920 |
9919 |
47 |
23 |
38.38671875 |
8480 |
8479 |
48 |
11 |
37.28515625 |
7881 |
7880 |
Classification comparison
Comparison of inference time, F1 score and model size
Figure 15 Model size, speed and quality summary. The F1 score of the model is presented on Y axis. The inference time of the model is presented on X axis. The size of the model is represented by the size of its point.
Model name |
Mean Inference time [s] |
Size [MB] |
F1 score |
|---|---|---|---|
workspace.automl-results.1234_12_5.0.measurements.json |
0.000844 |
0.032 |
0.250000 |
workspace.automl-results.1234_37_5.0.measurements.json |
0.000923 |
0.035 |
0.250000 |
workspace.automl-results.1234_3_5.0.measurements.json |
0.000409 |
0.016 |
0.250000 |
workspace.automl-results.1234_16_5.0.measurements.json |
0.001246 |
0.047 |
0.250000 |
workspace.automl-results.1234_41_5.0.measurements.json |
0.000558 |
0.025 |
0.250000 |
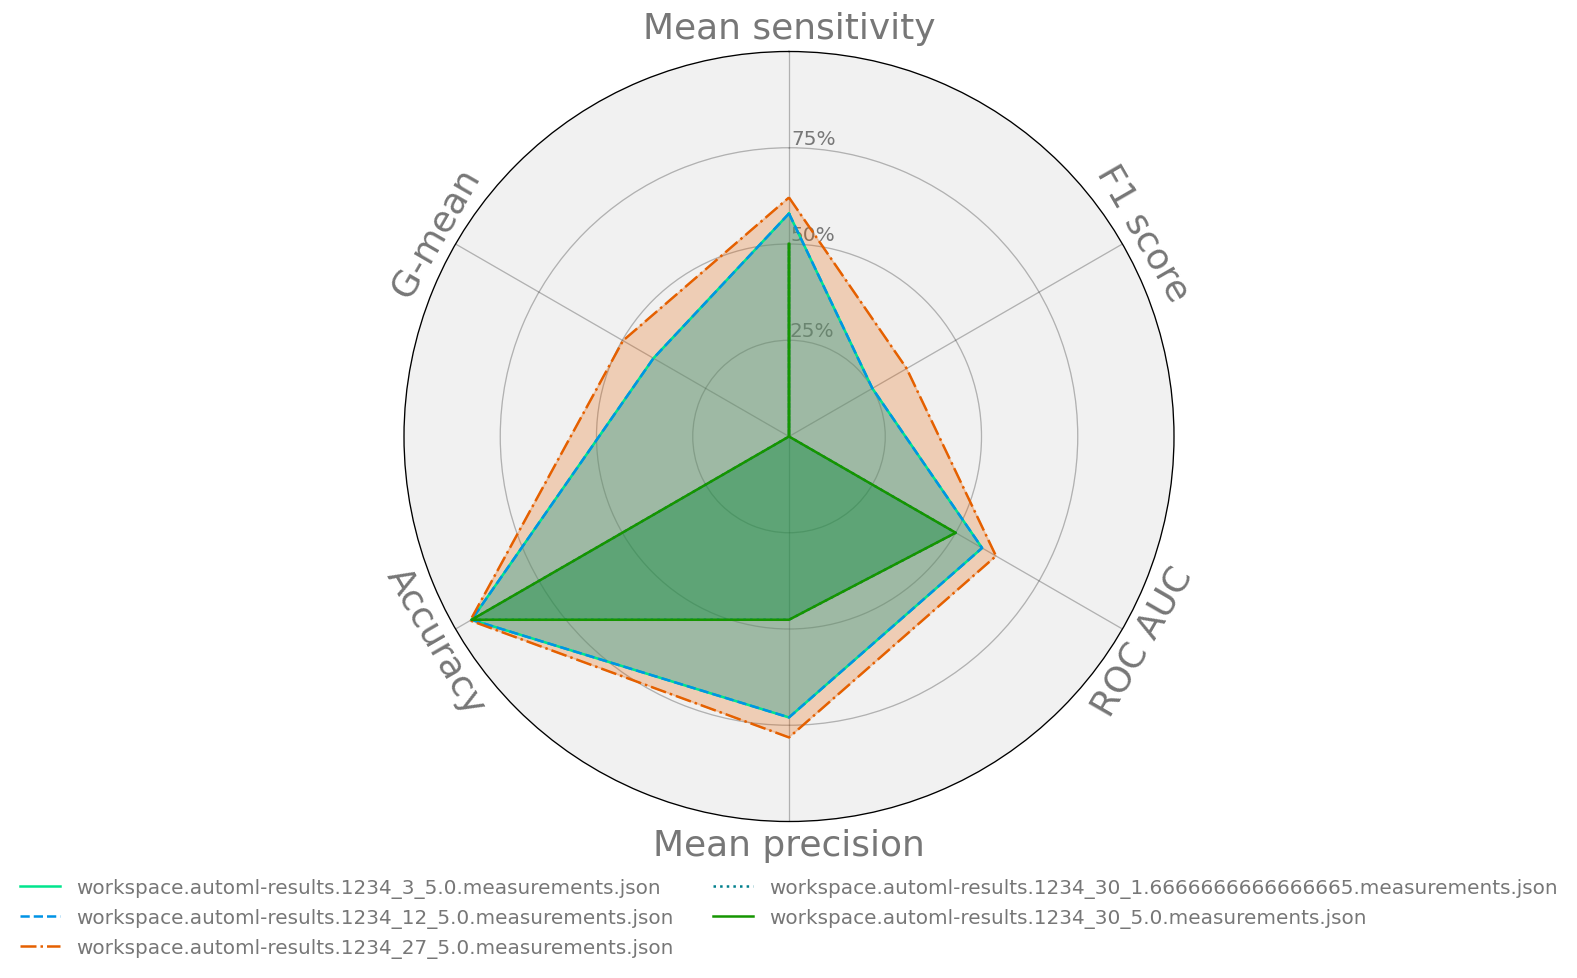
Detailed metrics comparison
Figure 16 Radar chart representing the accuracy, precision and recall for models
Model name |
Accuracy |
F1 score |
G-mean |
Mean precision |
Mean sensitivity |
ROC AUC |
|---|---|---|---|---|---|---|
workspace.automl-results.1234_12_5.0.measurements.json |
0.952000 |
0.250000 |
0.406529 |
0.729675 |
0.579132 |
0.579132 |
workspace.automl-results.1234_37_5.0.measurements.json |
0.952000 |
0.250000 |
0.406529 |
0.729675 |
0.579132 |
0.579132 |
workspace.automl-results.1234_3_5.0.measurements.json |
0.952000 |
0.250000 |
0.406529 |
0.729675 |
0.579132 |
0.579132 |
workspace.automl-results.1234_16_5.0.measurements.json |
0.952000 |
0.250000 |
0.406529 |
0.729675 |
0.579132 |
0.579132 |
workspace.automl-results.1234_41_5.0.measurements.json |
0.952000 |
0.250000 |
0.406529 |
0.729675 |
0.579132 |
0.579132 |
Inference comparison
Performance metrics
Figure 17 Plot represents changes of inference time over time for all models.
Model name |
Minimum [s] |
Standard deviation [s] |
Mean [s] |
Median [s] |
Maximum [s] |
|---|---|---|---|---|---|
workspace.automl-results.1234_12_5.0.measurements.json |
0.000823 |
0.000010 |
0.000844 |
0.000844 |
0.000951 |
workspace.automl-results.1234_37_5.0.measurements.json |
0.000900 |
0.000008 |
0.000923 |
0.000923 |
0.000955 |
workspace.automl-results.1234_3_5.0.measurements.json |
0.000389 |
0.000007 |
0.000409 |
0.000408 |
0.000453 |
workspace.automl-results.1234_16_5.0.measurements.json |
0.001229 |
0.000008 |
0.001246 |
0.001245 |
0.001342 |
workspace.automl-results.1234_41_5.0.measurements.json |
0.000542 |
0.000011 |
0.000558 |
0.000556 |
0.000659 |
Mean comparison plots
Figure 18 Violin chart representing distribution of values for performance metrics for models
Model name |
Inference time [s] |
|---|---|
workspace.automl-results.1234_12_5.0.measurements.json |
0.000844 |
workspace.automl-results.1234_37_5.0.measurements.json |
0.000923 |
workspace.automl-results.1234_3_5.0.measurements.json |
0.000409 |
workspace.automl-results.1234_16_5.0.measurements.json |
0.001246 |
workspace.automl-results.1234_41_5.0.measurements.json |
0.000558 |